Analytics: How-To Guide
Analytics: How-To Guide
Flourish Analytics empowers you to dig deep into your business through both visualization Dashboards and Standard Reports, all available from your main Flourish left menu under Analytics. Aside from viewing your data, some there are additional functions to help you harvest meaningful data out of the system.
This guide will cover:
- Dashboards vs. Reports
- Filters
- Drilldowns
- Exports
- Scheduling
Dashboards vs. Reports
The main distinction between a Dashboard and a Report is that a Dashboard provides more visual data related to a topic with multiple tiles where as a report provides deeper, grid-like presentation of your data.
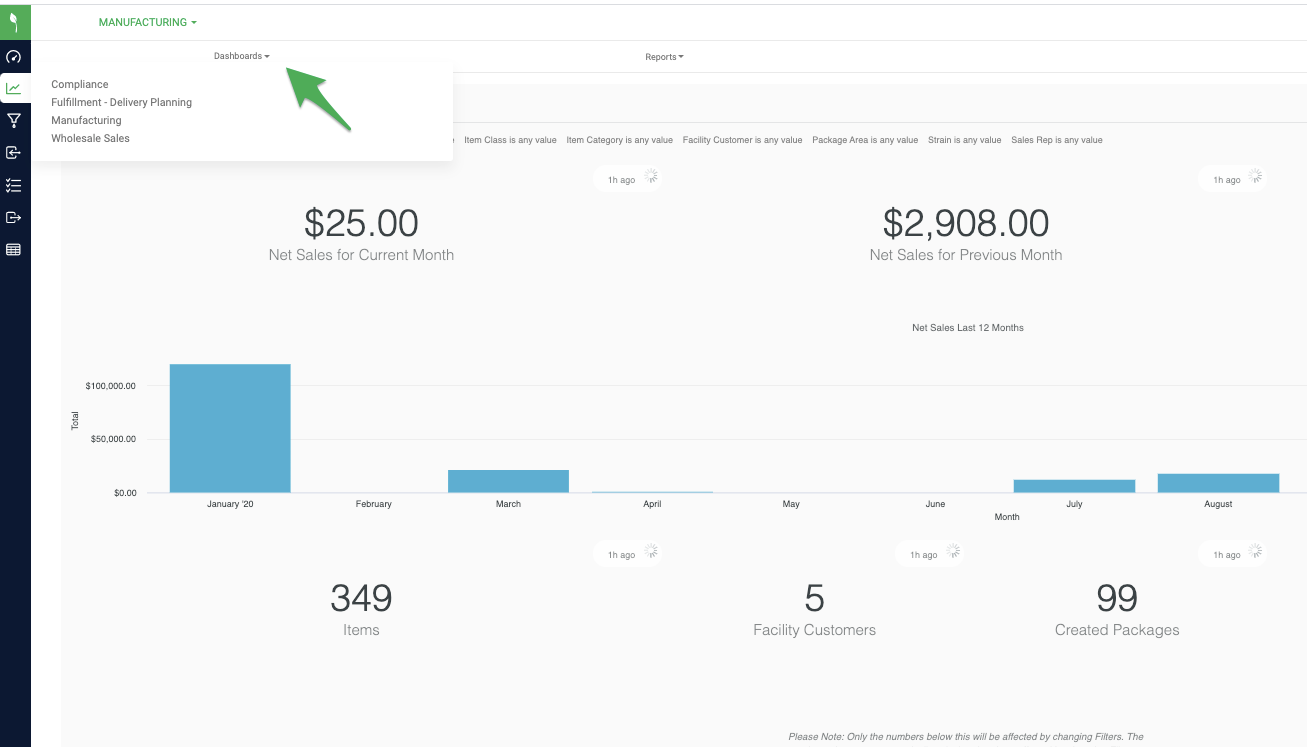
To navigate to a Dashboard, use the top menu to choose your dashboard.
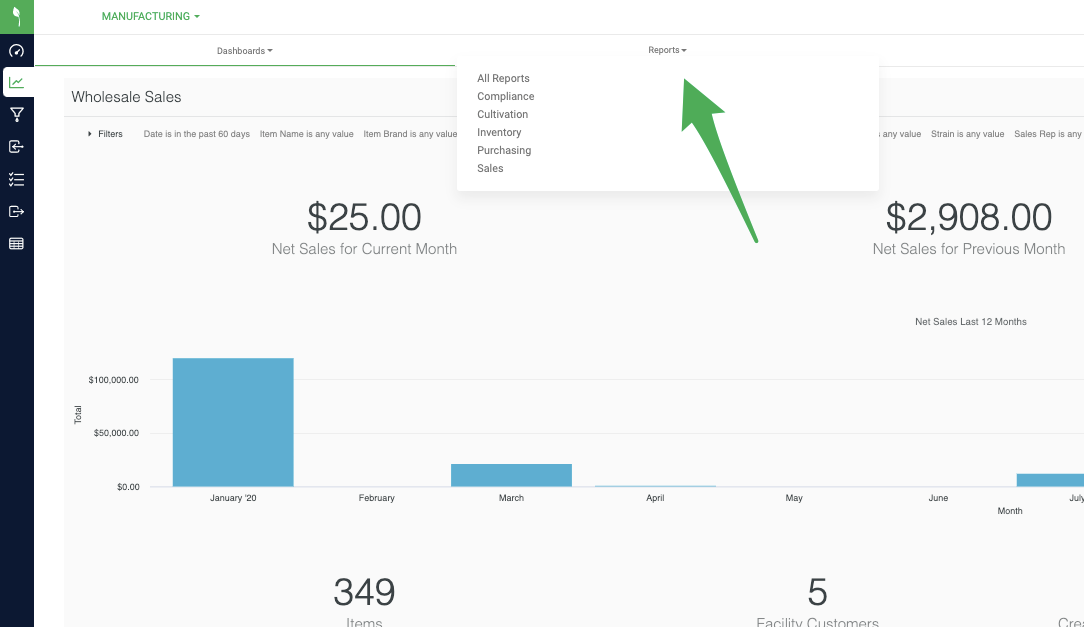
To find a Report, choose the menu to the right and either select a Report category or find a report in the All Reports list.
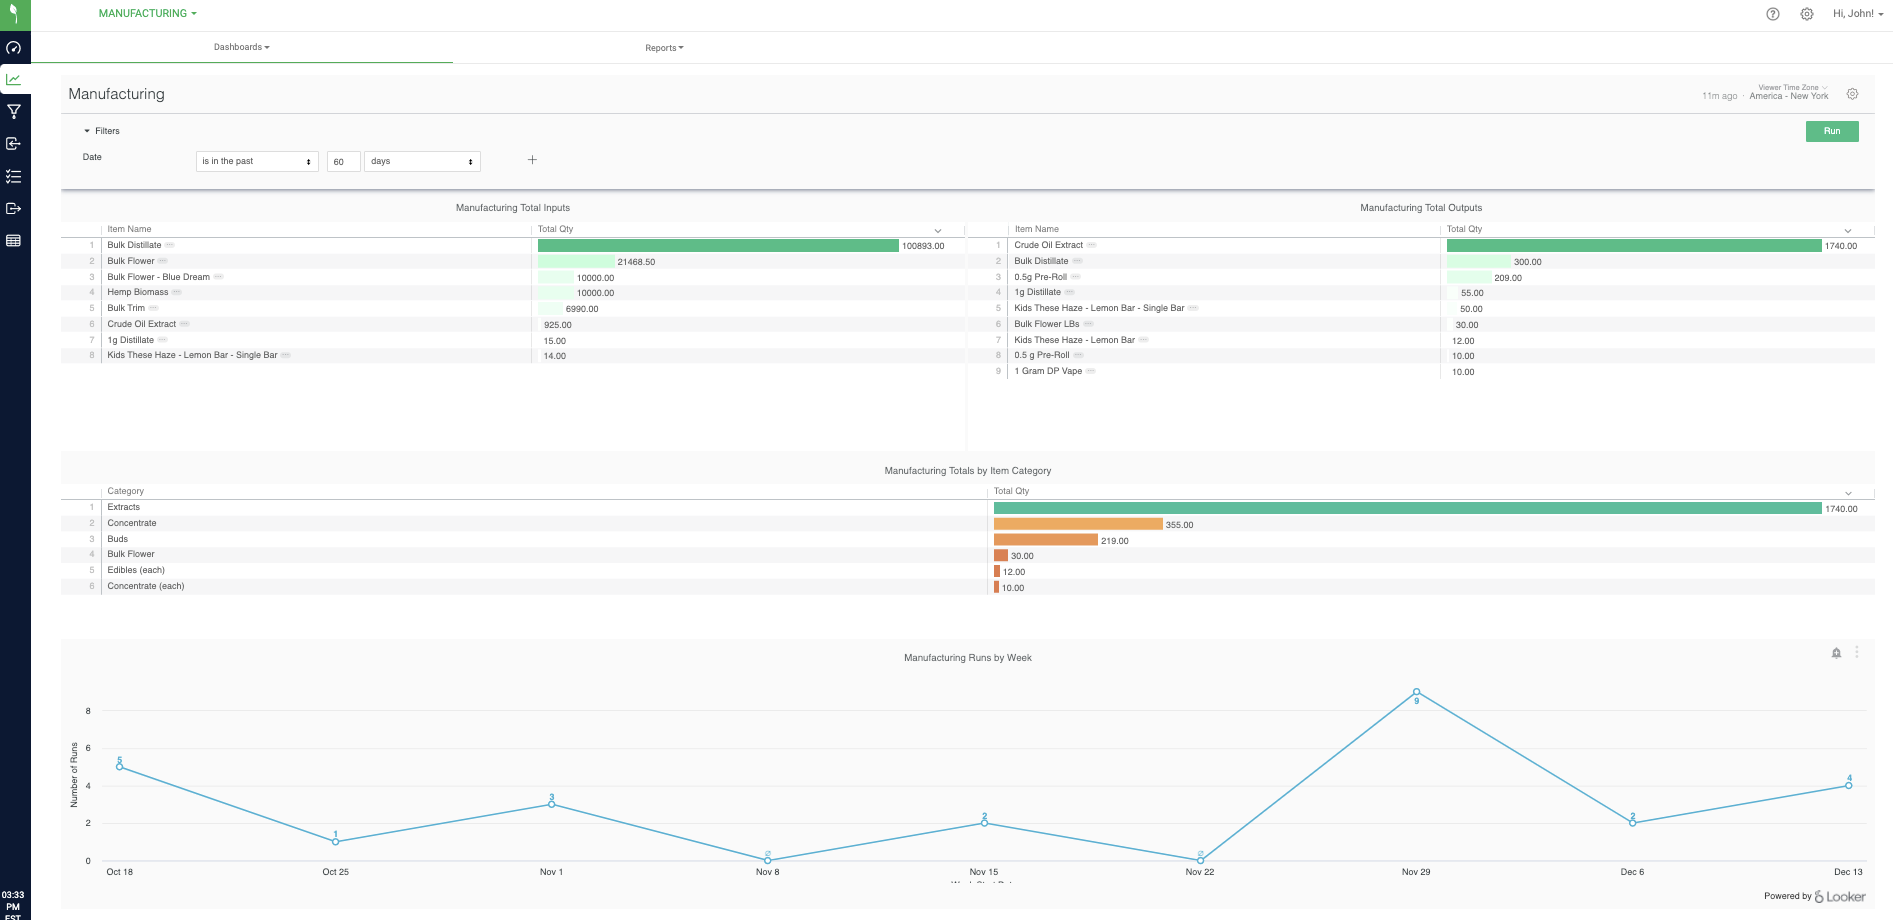
For example, a Dashboard may have related tiles all in one view such as: Manufacturing Totals by Item, Manufacturing Runs by Week, Manufacturing Total Inputs.
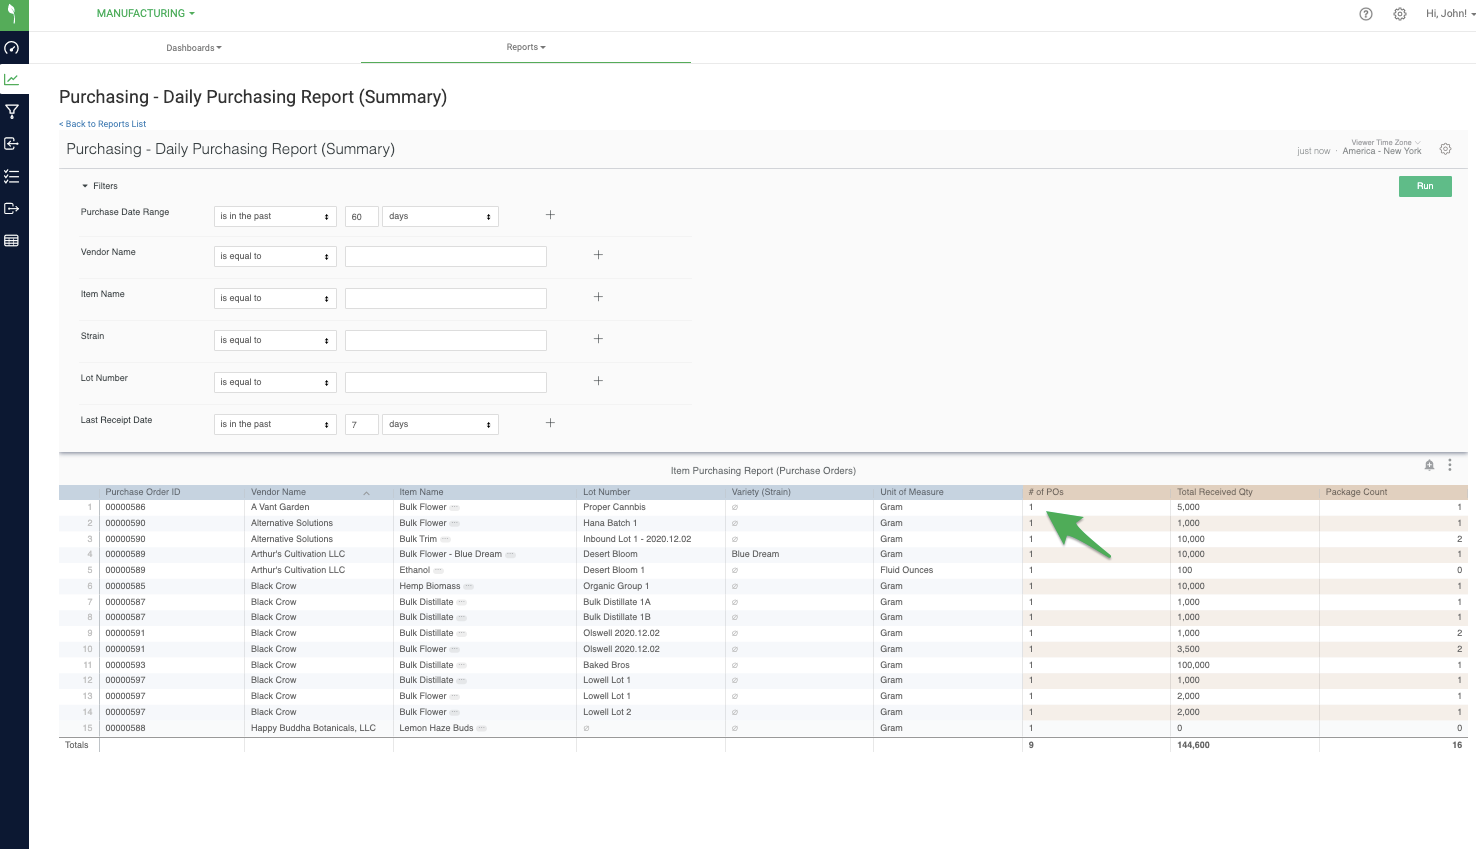
An example of a Report would be might take this deeper into Manufacturing Run Details:
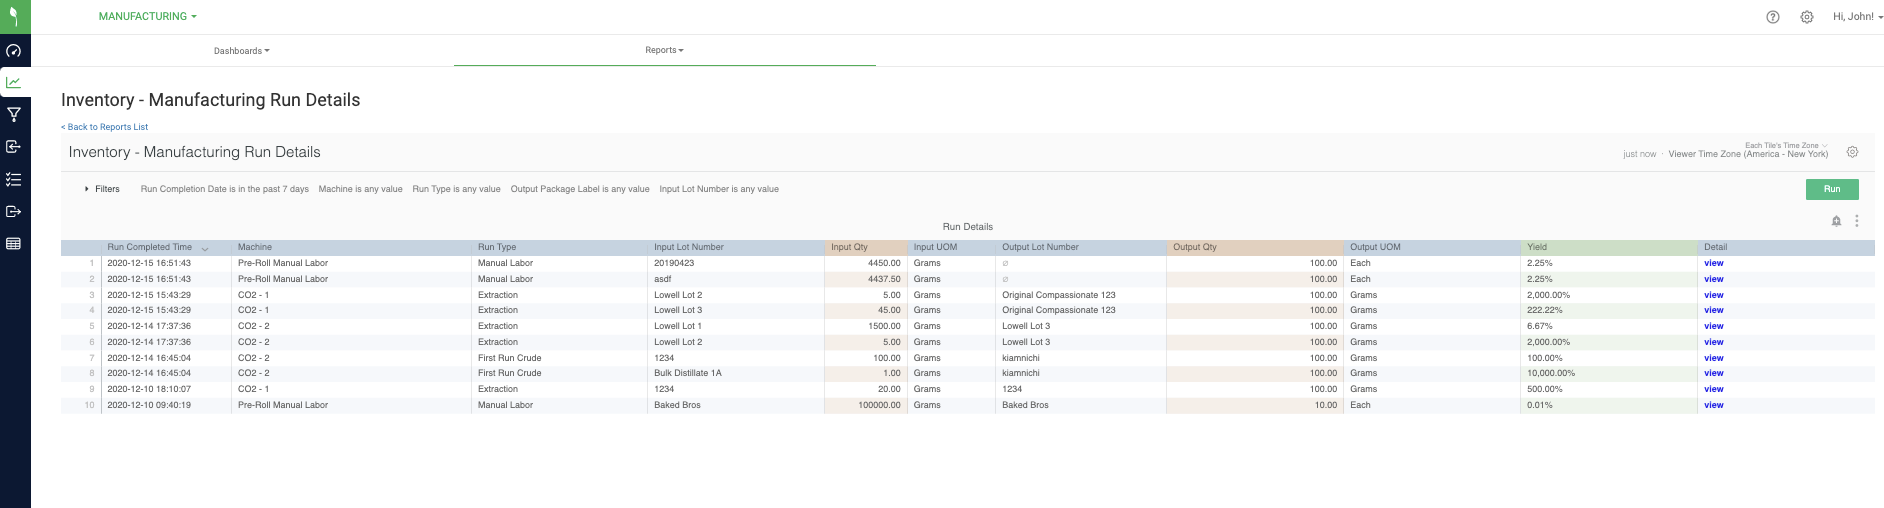
Filters
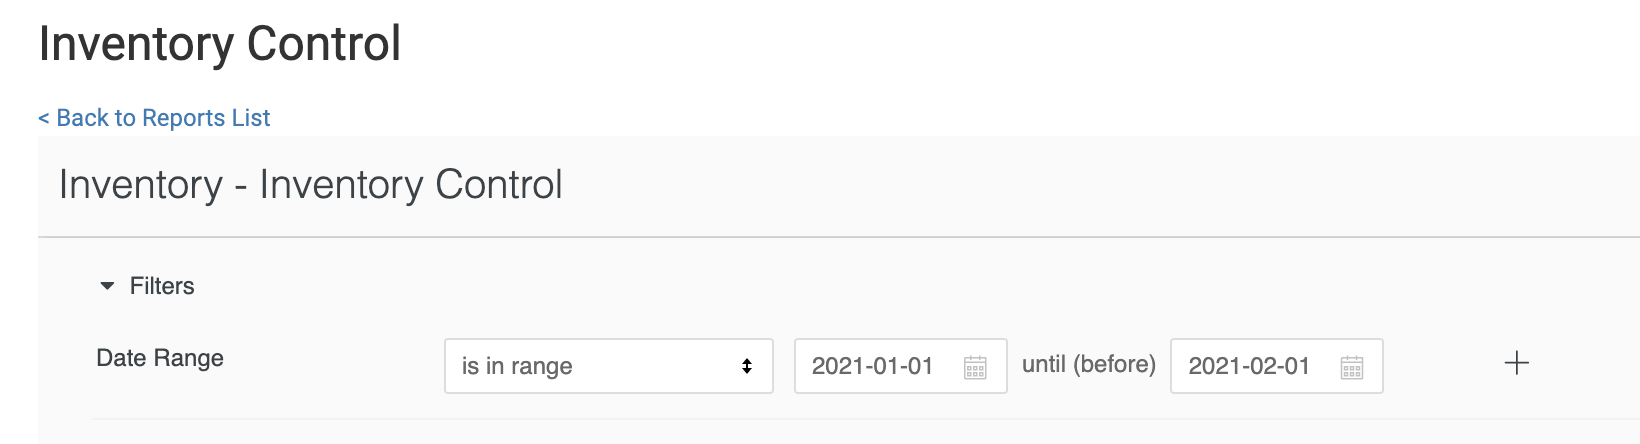
By expanding the Filters arrow at the top of a Report or Dashboard, there will be options for narrowing or expanding your data set. Filters are specific to the Report or Dashboard as they are relevant. If there is data you are expecting to show up that isn't, Filters are often a good first place to start.
NOTE: If you are using any date filter, use the date after the last date in the range to obtain the results for the given date range. Example, to get data for January 1st through 31st, put the starting date as Jan 1st and the ending date as February 1st.
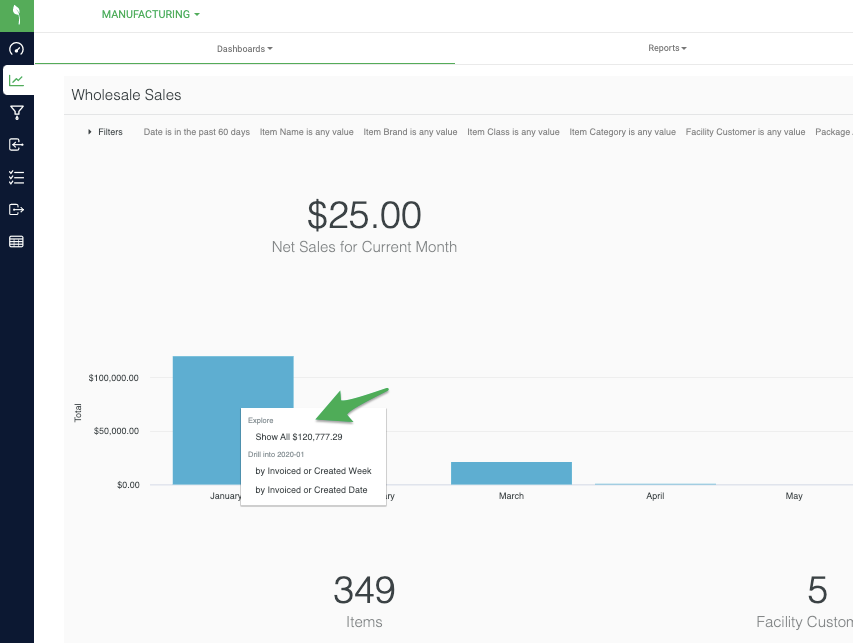
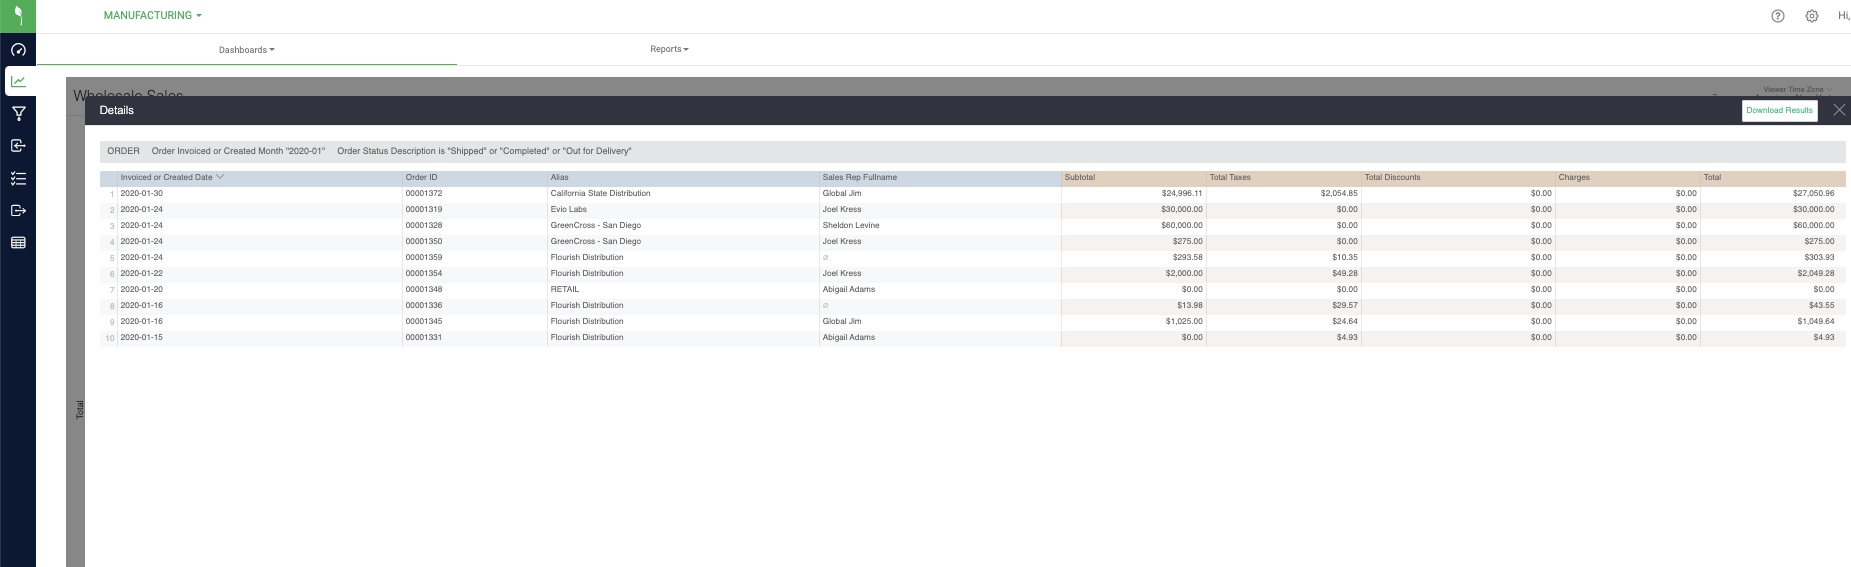
Drilldowns
Some Reports and Dashboards have Drilldown capabilities. This means starting from a higher level set, you can isolate a row or data point to get deeper into its makeup. To access a Drilldown, hover over the visual or specific line which will link to a menu for Drilling.
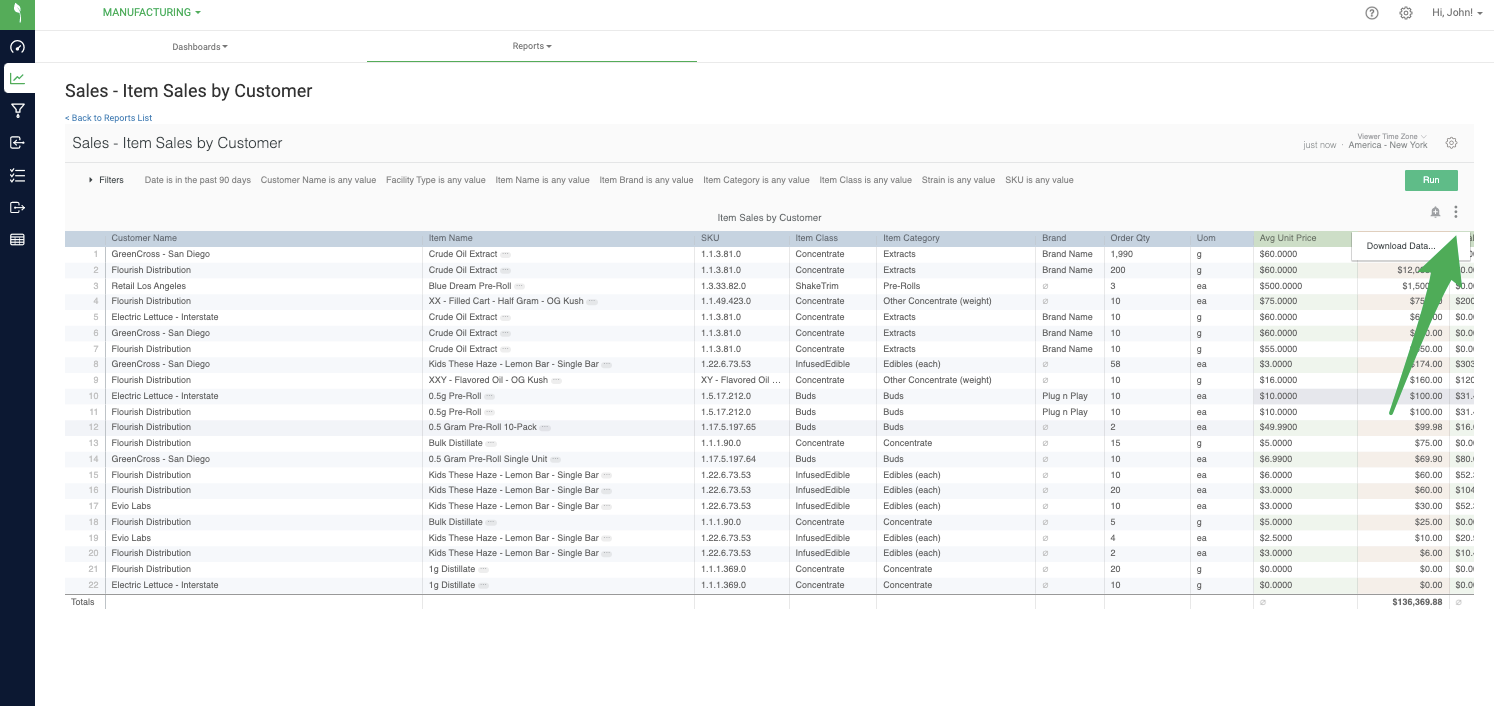
Exports
Most reports are exportable through the system to Excel, CSV, or PDF. Click the three vertical dots for the option to download this data.
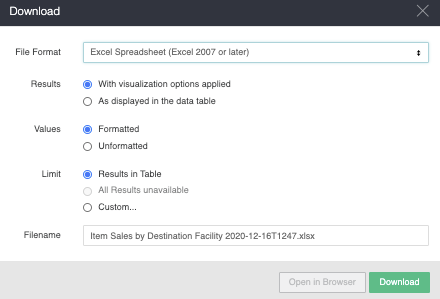
The maximum number of rows to export by default is 5000, but if there are more than 5000 rows be sure to click the radio button "All Results" to export all the rows in the table.
Scheduling
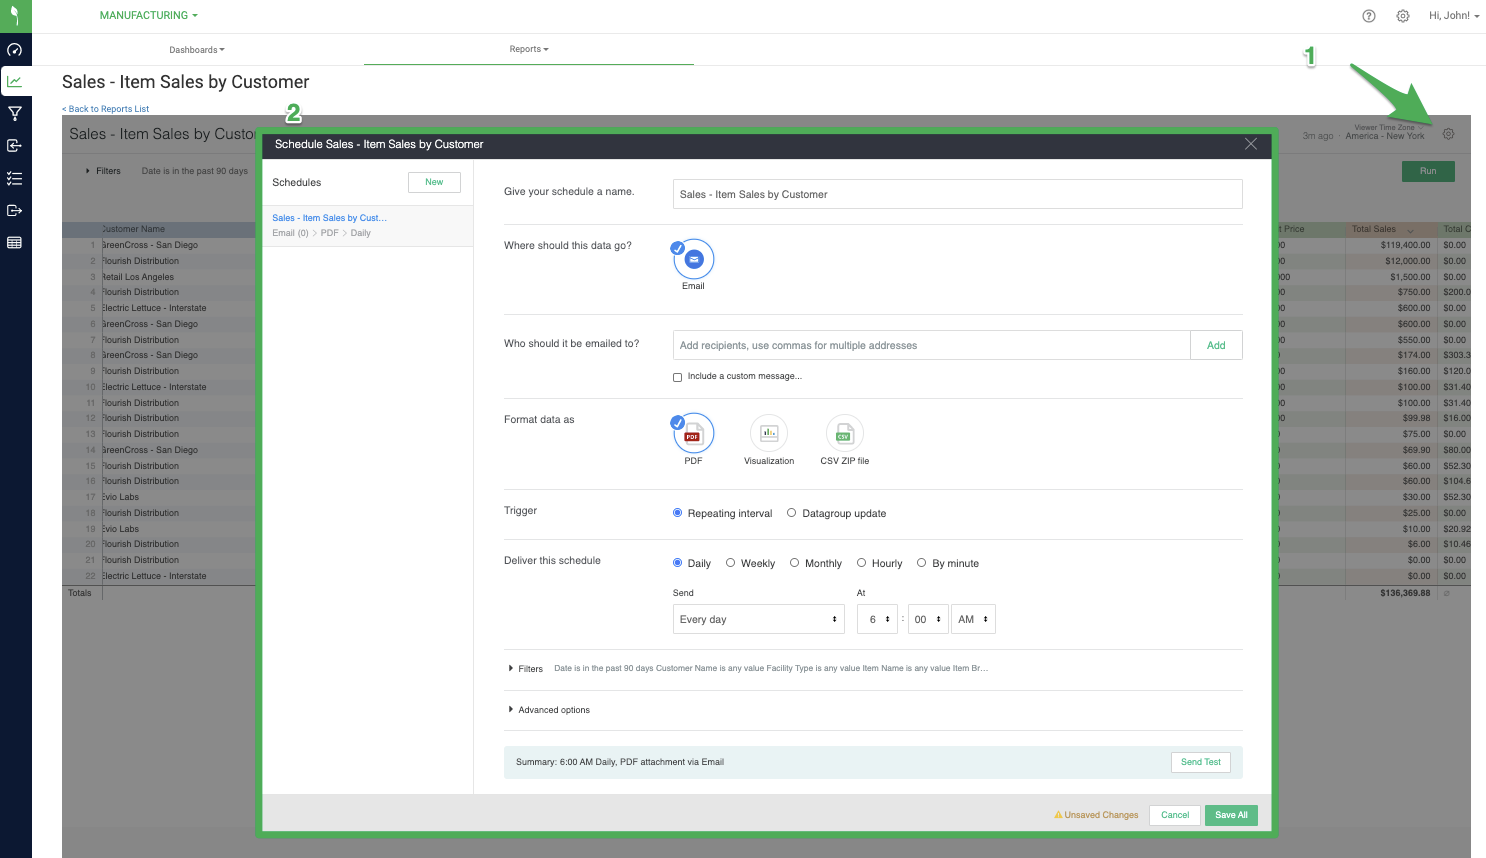
Rather than log into the system to pull a daily report, you have the option to choose to automate a scheduled copy of the report to a recipient list. In the main report header, first click the gearbox, and navigate to "Schedule".
A pop-up will then appear to set the rules of the schedule report, the list of recipients, and the frequency.