Dashboards
Dashboard
The Dashboard is used for creating reports that need special permissions or might involve custom reports that are not part of standard Analytics reporting. It can be customized with widgets to visually get a picture of everything from remaining harvest weights, plant counts by status, active inventory, etc.
Dashboards can be imported via excel templates and exported into excel.

Flourish's Dashboard is a configurable, custom view into your business. The dashboard contains all your reporting and allows you to view key metrics via widgets (i.e. - graphs, grid view, charts, etc.). We deploy several tabs to separate information. An Admin can set permissions for each tab.
- Configuring the Dashboard
- Dashboard Layouts
- Adding a Widget
- Expand and Collapse
- Configuring a Widget
- Types of widgets
- SQL standards
- Widget display configuration
Monitoring
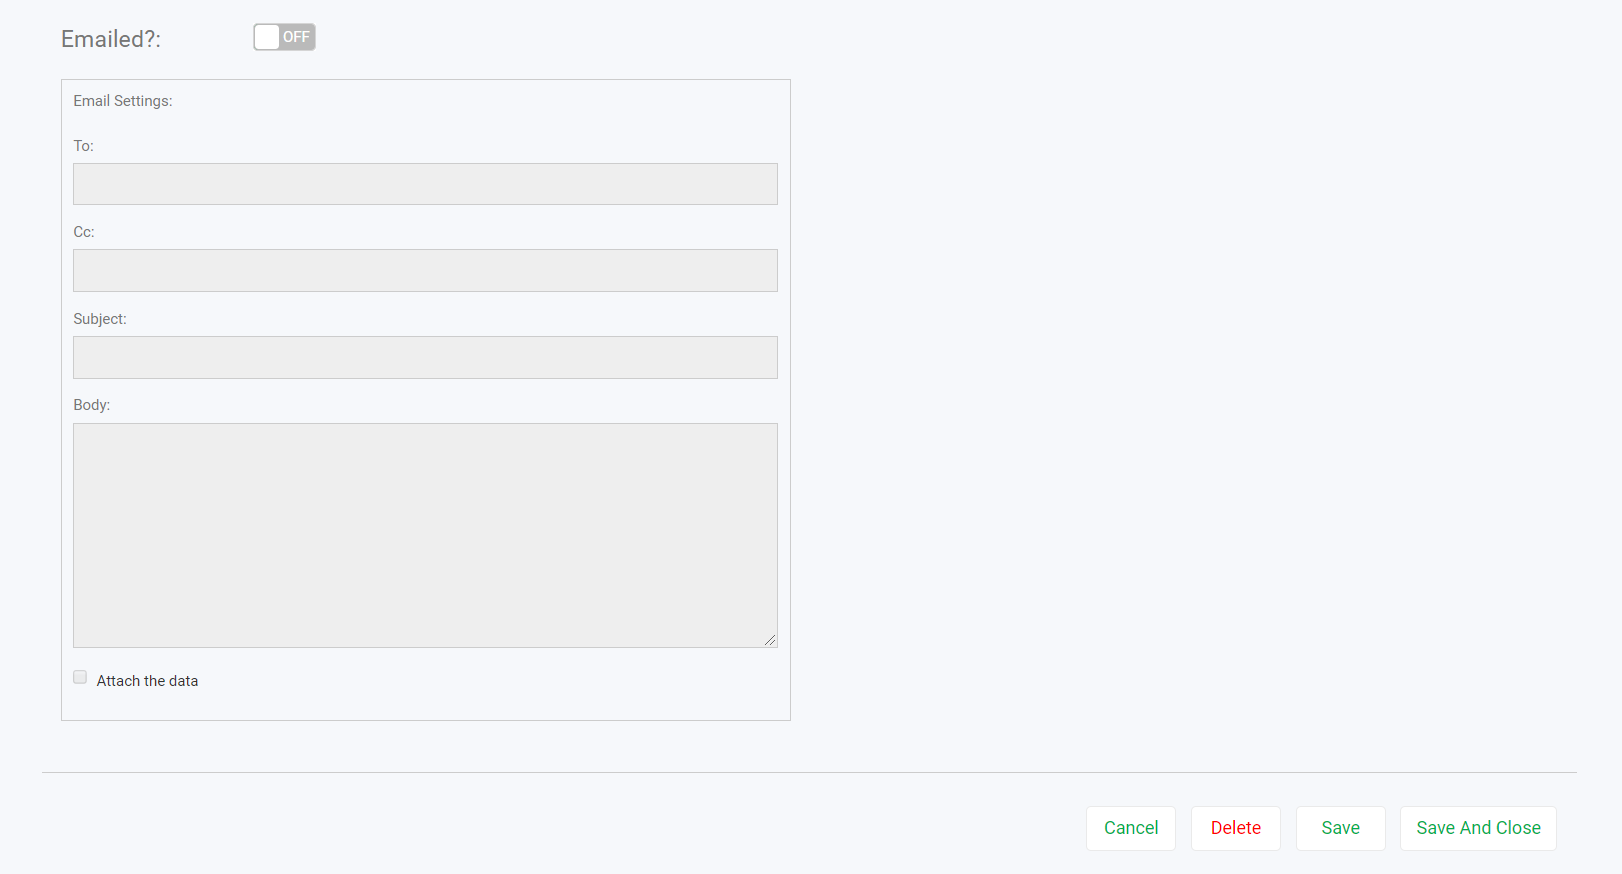
The monitoring module is used to provide a second set of eyes on your business. Users can set up notifications as well (i.e. - if your browser's tab permissions are configurable).
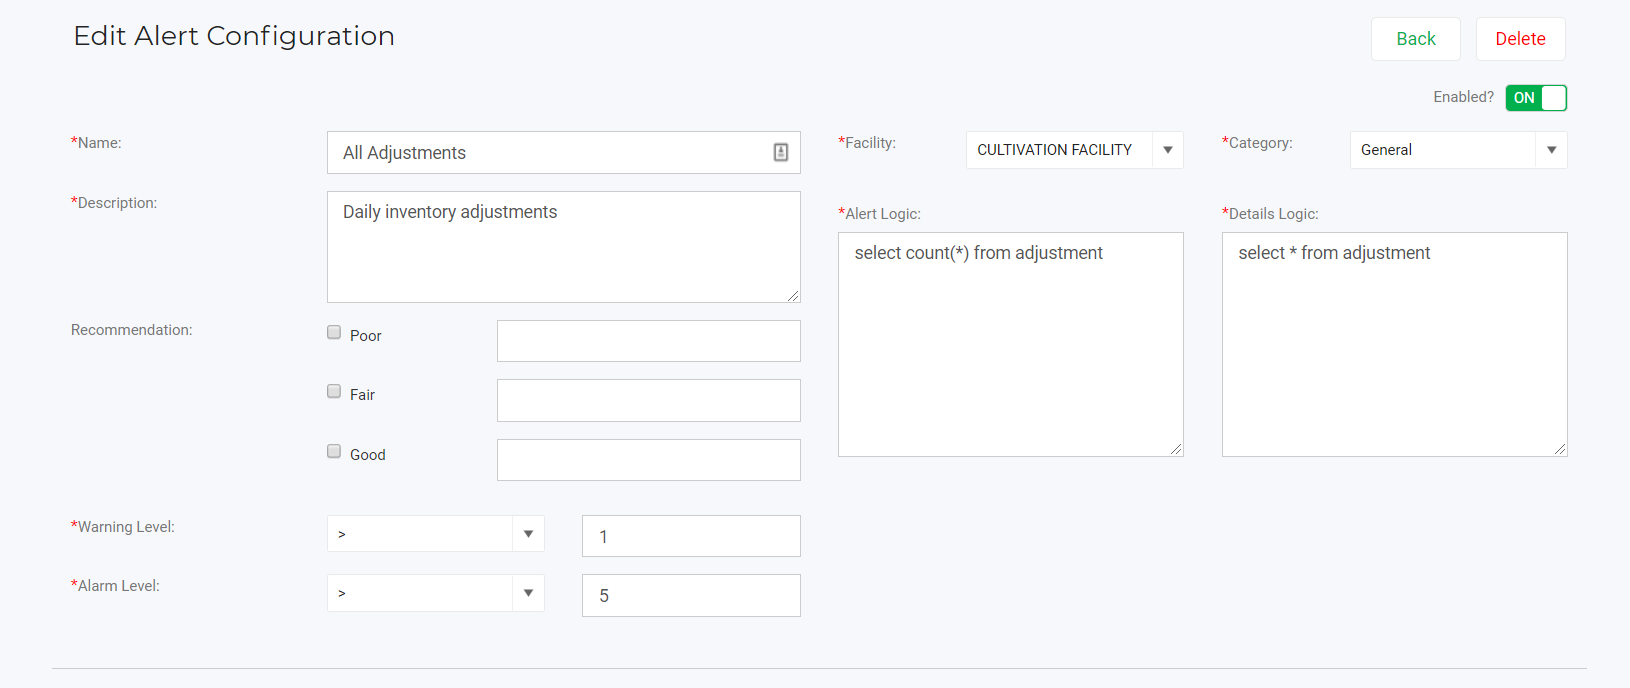
- Add/Edit/Disable an alert
- Create an alert
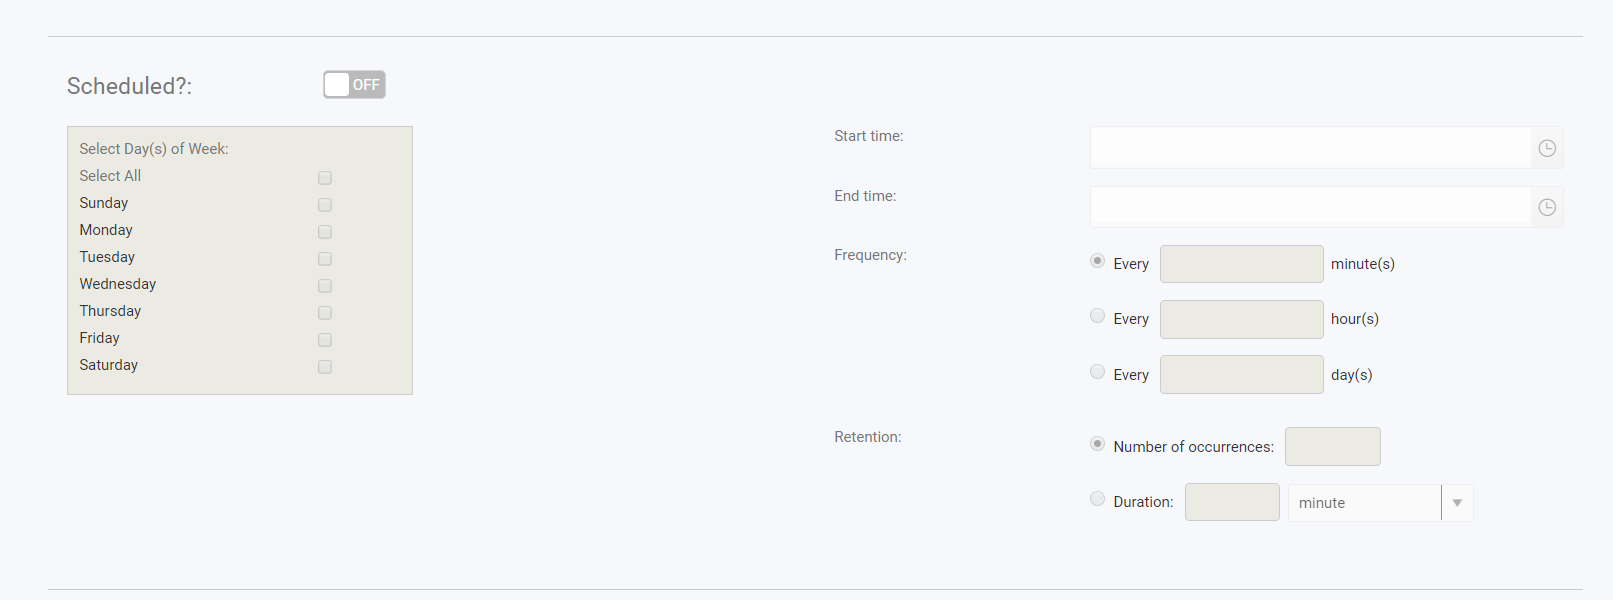
- Schedule an alert


Alerts are created using a combination of configuration options and SQL statements to present the data to be monitored.