Inventory Planning Dashboards

The Inventory Planning dashboards display essential information to help plan capacity, procurement, and manufacturing for items made using a bill of materials.
The Dashboards
There are two dashboards:
Inventory Planning Summary
- Displays the information for all the items you make using a Bill of materials.
- Please find it in Analytics / Dashboards / Inventory Planning Summary.
Inventory Planning SKU
- Displays the information at the SKU level.
- Please find it in Analytics / Dashboards / Inventory Planning SKU.
Report Definitions
The terms of that data refer to both dashboards.
Days on Hand
Days on Hand (Based on Historical Sales)
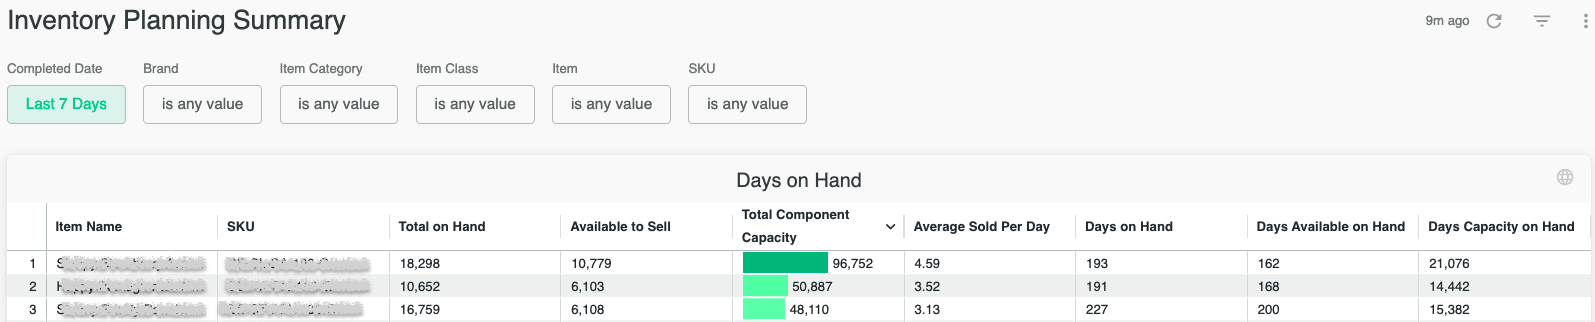
This value is based on the current inventory and displays how many days you can continue to sell in the same volume calculated from historical sales.
- Days on hand is how many days you can sell based on historical demand. Use the prompt to choose how many days you want to look back.
For example:- You sell 500 a day and have 10,000 on hand. Days on hand is 10,000 / 500 = 20.
- Days Available on hand is the number of days based on your sellable quantity of on hand inventory.
- Days Capacity on hand is the number of days based on how much you can potentially manufacture and sell if you use all your existing components to create the item. Note: If a component can go into multiple items, that is not factored into the report.
- Total Component Capacity (Click the number on the green bar to see the quantities of the components)
The BOM component:- With the least available quantity.
- It is not out of stock or is zero available.
Inventory Coverage
Inventory Coverage for Current Demand

This coverage is based on the current incomplete orders in Flourish and your current inventory. It displays how many you can sell now and how many you can potentially manufacture to sell if you use all your existing components to create the item.
- On Hand Coverage - The number of days you can sell your item based on what is currently on order and your inventory.
- Available Coverage - The same as above, based on your sellable inventory.
- Capacity Coverage - The number of days based on how many you can potentially manufacture and sell if you used all your existing components to create the item.
- Total Component Capacity (Click the number on the green bar to see the quantities of the components)
The BOM component:- With the least available quantity.
- It is not out of stock or is zero available.
For example:
You have 300 on order (which is the current demand). You have 600 in stock but enough parts to make 1200. You have two days of On Hand Coverage (600 / 300 = 2) and four days of Capacity Coverage (1200/300 = 4).
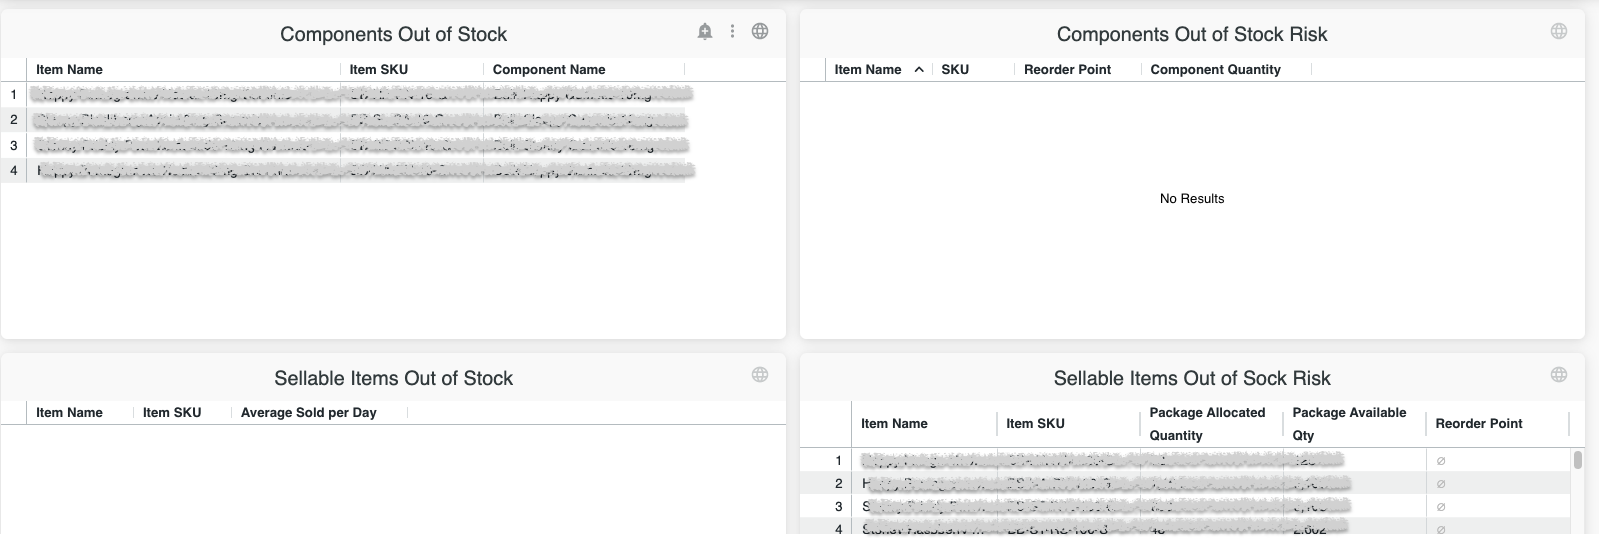
Out-of-Stock
Sellable/Components Items Out of Stock
Displays the Items that do not have any on-hand inventory.
Out-of-Stock Risk
Sellable/Components Items Out of Stock Risk
Displays the Items that have less on hand than the re-order point defined in the item master.