Getting Started
Login, Modules Overview, and Access
Analytics Overview
Support Options
Billing Module
Flourish Supported Hardware, Networking, and Vendors
Edit Your Flourish Software User Profile
Submit a New Idea to Flourish Software
Configuration & Setup
Company Settings
Editing Your Company Profile
Automatically Lock Packages Based on Test Result Status
Inventory - Extended Item Price (EIP)
Facility Settings
Facility Tag Settings
Manage Facility Payment Methods
Facility Compliance Screen
Update Facility and Invoice Origin Address
Update License Number
Update Phone Number
Configure and Manage a Reverse Sync User
Facility Area and Location Management
Configurations per Facility
Labels & Printing
Flourish Label Maker - Configure Labels
Printer and hardware options and setup
QZ Tray Certificate renewal
Allowing Local Network Access for QZ Tray
Example Guide: Subnetting a Router for 250 Local IP Addresses with Static IP Assignments
Printer Setup and Connectivity Guide
Flourish Software Cannabinoid and Terpene List
Flourish COA Portal QR Code - Arizona Requirements
Installing a Unicode-Supported Font on Zebra Printers
Labeling Guide for Dose Based Items (Capsules, Drinks, Edibles, Tinctures, etc.)
Distribution
Distribution Setup
Managing Destinations
Create and Update Destinations In Bulk
Managing Sales Reps
Assign Sales Reps to a Destination
Add/Create Vendors
Create And Update Vendors In Bulk
How to Tag Drivers
Create and Manage Vehicles
Create And Manage Drivers
Destinations: Company and Delivery Information
Managing Destination Contact and Job Titles
Users & Permissions
User Roles and Facility Permissions
Creating and Managing Users
Setting Up Users for Mobile Access
How to enable "Update financial info for shipped orders"
Enable Add a New Physician to User Roles
Resetting Your Password in Flourish
Reset User PIN (Point of Sale or Mobile)
Retail POS - Allow to Allocate Inventory to a Purchase Order Manually
Flourish Compliance Credential Guides
Prevent Users from Exporting All Grid Data
Manufacturing Machine & Run Configuration
Item Pricing - Update Multiple Item Prices
Create and Update Strains in Bulk
Enable the creation of new items from the Inventory Screens
Update Items in bulk
Item Price Sets
Retail Return Reason Codes
Create and Manage Shifts
Bulk Item Create Instructions
Case Label Item Configuration and Printing
Cultivation
Grow / Cultivation Overview
Entering in Dry Weights
Overview: Plant Groups and Plant Batches
Change Strain on a Plant
How to split a group
Changing the UOM of a Harvest's Wet Weight
How to Bulk Destroy Plant IDs
Adjust Expected Harvest Date
Splitting Immature Plant Groups
Non-METRC Creating a Package of Clones
How to create strains
How to Move Plants
How to Create Clones From a Mother Group
Entering in Wet Weights by Group (non-METRC)
METRC Harvest: Record Wet Weight with Scale and Scanner
Cultivation Area Attributes
How to Manicure a Harvest
Creating New Strains
Entering in Dry Weights and Creating Packages from Harvest
How to Apply Additives to Plants
How to Kill plants
Destroying Plants: Logging Waste / Notes
Cultivation - How to Revive Plants (No Tracking System)
Creating Plants in Flourish Software
Move harvested strains back to the Flowering phase
Record METRC Harvest with Total Wet Weight
Reprint Plant Tags
Non-METRC - Move a harvest back from 'Processing' to the 'Harvest' phase
How to Kill Individual Plant IDs
How to Make a Mother Group
Kill Individual Plant IDs from Plant Groups
NON-METRC - How to Make a Clone
Harvest packages and Configuration
Making "Fresh Frozen" products from wet weights.
Canada - Destroy plants
METRC Harvesting - wet and dry weights, waste, harvest packages and completion.
Complete and Uncomplete a Harvest
Creating a Package from Harvest
Record Cultivation Waste (Pre-Harvest)
METRC - Recording Cultivation Waste
Edit Expected Flower/Harvest Date on the Group View
Flourish Software Harvesting
Flourish Analytics
Flourish Analytics - Getting Started
Flourish Analytics - Set User Access and Access Level
Flourish Analytics - Browse Content
Flourish Analytics - Set a Workbook as Favorite
Flourish Analytics - Customize and Bookmark the Data
Flourish Analytics - Export Data
Flourish Software messages and notifications
NewYork Microbusiness Tax Filing SOP
Flourish Software Snowflake Marketplace Data Listing
Android Mobile App
Mobile App: General
Flourish Android Mobile App Overview
Mobile App Login
Mobile User Roles
Mobile Scanning Devices
Mobile Zebra Scanners - connect to Flourish Software app - DataWedge App Setup
Android App Mobile Settings: Choose Package ID to Display
Mobile App: Cultivation
Mobile App - Using a scanner for Cultivation Actions
Mobile App - RFID Plant Counts
Mobile App - Harvest - Scan and Record Weights for Plants
Mobile App: Inventory
Mobile App Inventory: Assign a Package to an Order
Mobile App Inventory: Update Lot Number for Non-Cannabis Inventory
Mobile App Inventory: Locate Non-Cannabis
Mobile App Inventory: Take Lab Sample
Mobile App Inventory: Create a New Package
Mobile App Inventory: Lock Package
Mobile App - BioTrack 2.0 - Creating Lab Samples
Mobile App Inventory: Adjust Package
Mobile App Inventory: Adjust Non-Cannabis Inventory
Mobile App Inventory: Locate Package
Mobile App: Inventory Counts
Mobile Inventory Counts Overview
Mobile Inventory Count - Enter the Number of Packages per Item
Mobile Inventory Counts: Scan Packages per Item
Mobile RFID Inventory Counts
Mobile App: Outbound
Mobile App: Shipments
Android mobile - Allocate non-cannabis inventory
Mobile Order Line Screen
Mobile App: Build Orders by Scanning and Allocating Packages
Mobile App: Retail
eCommerce
Jane Technologies
Flourish WooCommerce
Setting up WordPress Site, WooCommerce, and Plugins
Flourish WooCommerce Wholesale Configuration Guide
WooCommerce Wholesale Store Branding and Client Experience Guide
Managing Multi Accounts and Sub Accounts in WooCommerce
Flourish Wholesale Portal User Guide for Buyers
Order Sync Workflow - WooCommerce to Flourish Application
Inbound
Inbound Module Overview
Inbound Purchase Orders
Inbound - Display Additional fields next to item names on purchase order lines
Tutorial: Create Purchase Order
Receive Inbound Transfers and Purchase Orders (No Compliance System)
Inbound - Receive The Whole Purchase Order In One Click
Quick Receive Non-Cannabis Inventory
Moisture Tracking
METRC Inbound Process
Inventory
Bulk Actions
Bulk Actions - Add Packages to an Order
Bulk Actions - Combine Packages
Bulk Actions - Locate Packages
Bulk Actions - Lock and Unlock Packages
Bulk Actions - Add to a Manufacturing Run
Bulk Actions - Print Package Labels
Bulk actions - Update Unit weight
Create Items in Bulk
Inventory Counts
Inventory Settings
Item Creation & Management
Package Unit Cost Inheritance and Calculation
Creating a Custom Category
Manage Item Ecommerce Names
Add Ingredients to Items and print in outbound PDF
Inventory Management Principles
Classes & Categories
Clone an Existing Item or BOM
Duplicate an Item to Create a New Item
Lock Codes, Adjustment Codes, & Return Reasons
External and Internal Items
Item Tagging Functionality
Chart of Account Mapping
Configuring Item E-Commerce Categories and Subcategories
Item Strain Type
Change an Item Category
Item Vendor UOM Conversion
Inventory Management
Custom Grid Column Ordering
Brand Management
Web Inventory Counts: Enter the Number of Packages per Item
Print Labels For Non-Cannabis Items
Tutorial: Creating an Item
Create Package from Package
Inventory Adjustments
Create And Manage Custom Filters
Managing Inventory Lock Codes
Managing Chart of Accounts View - QuickBooks Online
Package History
Create Lab Samples when a Lab Test Batch "Required Testing" (LTB Option) is required.
Create multiple packages with different quantities in one session.
Update The Unit Weight for a single package
Create or edit a Brand for an Item.
Reprint Package Label
Automatically calculate the "Use By Date" for new packages.
Inventory: Recording a lab result and uploading COAs
Non-Inventory Items
Creating Trade Sample Packages and Trade Sample Adjustments
Inventory: Package Reference Fields
Flourish Costing
Inventory Audits
METRC - Retag Packages - Change the item of a package.
Flourish Inventory
Editing Items after Creating Packages
METRC - Discontinue package in METRC and Re-sync to Flourish
Set The Unit Weight for Packages of Items with UOM of 'Each'
Refreshing Inventory Count Details
Outbound - Return Rejected Items to Inventory
MMJ Used Package Attribute
Manage Packages waste
Managing Non-Cannabis Inventory
Creating Packages and Auto-Prompting Label Printing
Inherit Package Attributes
Inventory: Upload PDF To Record Lab Test Results
Shelf Life Dates on Inventory Packages and Inventory Aging
Refresh Inventory of Non-Cannabis Items
Inventory: Package Attributes
Package Harvests Data Management
How to Know When to Restock Your Inventory
Finished Goods Package Attribute
Metrc Retail ID Guide
Manufacturing
Manufacturing Module Overview
Manufacturing Work Orders with BOMs
Creating Bill of Materials for Handling Case Quantities
Manufacturing Waste Log
Creating a Bill of Materials - BOM
Start a New Manufacturing Run
Creating Inventory using Bill of Materials
Outbound
Outbound Overview
Outbound Invoice
Outbound orders Payment Status
Outbound Order Discounts and Charges
Creating New Outbound Shipments (Non-METRC)
Add, Edit and Delete Order Notes
Scan Packages to add Order Lines and Allocate Packages to Outbound Orders
Allocate Packages to Outbound Order
Sales Order Approval
Outbound Order Notes
Outbound Module Operational Overview
Invoice Date
Split Packages During Order Allocation
Display Unit Cost and Total Cost when allocating packages to an outbound order.
Creating New Outbound Orders
Configuration: Only Show Items with Available Quantity
Split and Allocate Packages to an Outbound Order
Find Orders
Set a Default Distributor for your Outbound orders
Import Outbound Orders with a Spreadsheet
Change Facility - Move an Outbound Order between Flourish Facilities.
New York - Outbound - Manage Adult-Use Cannabis Products Tax
Printing Options on a Sales Order
Selling Cannabis Inventory by Lot
California Excise Tax Rate 2023 Update
How to update financial info for shipped orders
Packing List
Outbound Order Status Fields
Mark Sales orders as fully paid
Sales Order Payments
Retail / POS
AeroPay
POSaBIT
Customer Management
Adding a Physician
Creating a Customer Profile
Deleting a Customer
Merging Customer Profiles
Customer Preferred Name
Edit the credit available to customers
In-Store, Delivery, and Pickup Orders
Retail POS Printing and Reprinting Receipts
Creating a Retail Delivery Route
Retail POS Printing Customer Labels
Checking In a Customer
METRC Retail Delivery: Edit order after marking “Out For Delivery”
Create Retail Pick Up and Delivery Orders
Retail Order Statuses
Retail POS Refund a Purchase
Fulfilling a Retail Order
POS Item Scanning Rules
Retail POS Complete a Purchase
Retail POS Create an In-Store Purchase
Retail - POS - Split an order line into multiple lines of the same item.
Removing an Order from the POS
Retail POS - Refund a Manual Card Transaction
Retail POS - Refund a POSaBIT - Manual Transaction
Retail POS Quick Sale
Retail - Med and Rec purchases
Retail POS - Refund an AeroPay Transaction
Replace Customer - Change the Customer on a Retail Purchase
Retail - Cancel a Completed Purchase
Retail Purchase Limit Enforcement
Retail - Postal Shipping Orders
Till and Vault Management
Creating a Retail Transfer
Creating a Sub-Vault
Performing Pay Ins and Pay Outs
Closing a Till
Counting a Vault
Opening a Till
Reconciling E-Payments
Creating Retail Reasons
Creating a Till
Integrations
MMUR
MMUR CureAPI v4 (Florida Only)
MMUR Caregiver Selection
Florida Retail - Automatic Dispensation to MMUR on Delivery Orders
MMUR / CureAPI v4 Medical Cannabis Aggregate Limit
Alpine IQ Integration
Discounts
Retail Discounts Overview
Creating a Retail Discount
Retail — Standard and Advanced Discounts
Retail Discounts — Customer Attributes
Retail Discounts — Order Attributes
Applying a Retail Discount
Common Retail Discounts
In Store Menu
Flourish Software In Store Menu
In Store Menu Eligibility: Items and Discounts
In-Store Menu Controls
Vector Payments
Vector Payments Configuration
Vector Payments - POS Check Out and Reporting
Troubleshooting Vector Payments Terminals Not Connecting
Spendr
Retail
Till Report
Recording a POSaBIT transaction
Retail - POS - Set default printers and print
Retail Pre-Orders, Backorders, and Replacement Orders
Adding Payment Terminals & Assigning to a Till
Retail - Customer State ID, Medical ID data and expiration
Retail - Mark a Completed Purchase as Cancelled
Point of Sale Cash Drawer Configuration
Retail - Show Tax Breakdown by Type on Retail Sales Receipt
Retail Facility Configuration
Credit Card Manual payments for Retail Point of Sale
Retail Metrc Sync Error "Package Cannot Be Sold Because it Doesn't Exist in The Current Facility"
Retail - Void a Transaction
Retail - Export the Customer Purchase History
External API
Flourish Webhooks
Securing your webhooks
Flourish Software External API Key Management
Generate or Reset External API key
Integrations
Apex Trading
BarTender™
Google Workspace
LeafLink
LeafLink Integration Overview
LeafLink Integration Setup
Flourish LeafLink Integration Setup DIY - Start here!
Before Setting Up LeafLink Integration
LeafLink Integration Setup and Activation
After Setting Up and Activating the LeafLink Integration
Set a default Sales Representative for a customer in Leaflink
Leaflink Category Mapping with Custom Categories
Sync Flourish to multiple Leaflink Companies and Brands
LeafLink - Sell by Batch
LeafLink Integration - Exclude facilities from inventory quantity sync
Set The Status of Leaflink Orders to Sync To Flourish Software.
Leaflink Brands and Product Lines
LeafLink Troubleshooting
Outfield
Ordo
POSaBIT POS
QuickBooks Online
What Version of QuickBooks Online is Supported?
Integration: QuickBooks Online
QuickBooks Online Sync Settings
Enable Shipping Charges in QuickBooks Online
Disconnect (Un-map) Items, Destinations and Vendors
Setting Inventory Start Date
Switch your QuickBooks Online Account to work with Categories
Configuring Items for QuickBooks Online Sync
Enable Syncing of Outbound Orders to Quickbooks
Transition an Item from "Inventory" to "Non-Inventory" types in Flourish and QBO.
Quickbooks Online: Syncing Order Discounts
Send Flourish Data To QBO Sales Order Custom Fields
Zapier
Alpine IQ E-commerce
Connecting to Flourish with an LLM using our MCP Server
CYBRA MarkMagic® Integration Setup
Export Data From Flourish To QuickBooks Desktop
Flourish Software HubSpot App and Integration Guide
Flourish Analytics – Green Check Integration and Verified Reports
Seed Technology Integration
BioTrack
BioTrack (Connecticut)
Connecticut BioTrack Inbound
Connecticut BioTrack Cultivation Guide
Connecticut BioTrack Manifest Requirements
Connecticut Manifesting in Flourish for BioTrack Clients
Connecticut BioTrack Inventory
Connecticut BioTrack Category Conversions
Connecticut BioTrack - Accepting Rejected Inventory
BioTrack (Florida)
Florida BioTrack Integration Overview
Florida BioTrack Limitations
Florida BioTrack User Management
Florida BioTrack Drivers and Vehicles
Florida BioTrack Inventory Categories and Mapping
Florida BioTrack Item MMUR Configuration
Florida BioTrack Propagation
Florida BioTrack Cultivation Management
Florida BioTrack Harvesting
Florida BioTrack Inventory Creation
Florida BioTrack Inventory Destruction
Florida BioTrack Inventory Adjustments
Florida BioTrack - Undo Out of Sync Package
Florida BioTrack Inventory Count
Florida BioTrack Initial Inventory During 90 Day Conversion Window
Florida BioTrack Delivery Devices
Florida BioTrack Facility Areas Creation
Florida BioTrack Lab Samples and COA Management
Florida BioTrack Manufacturing
Florida BioTrack: Report Ingredients During Manufacturing
Florida BioTrack Inbound Receiving and Transfers
Florida BioTrack Order Fulfillment and Shipping
Florida Biotrack Retail Returns, Restocks, and Voids
Florida BioTrack: Plant Additives
Florida BioTrack: Retail POS User Guide
Florida BioTrack: Retail Fulfillment User Guide
Florida BioTrack: Retail Delivery User Guide
BioTrack (New Mexico)
How Flourish Areas Sync to BioTrack Rooms
METRC
METRC CA Microbusinesses Location Functionality.
New York Metrc
Item and Category Configuration for New York State Compliance
METRC - Create Immature Plant Batches
Receive a Metrc External Transfer
New York Metrc Item Category and Lab Testing Guidelines
How to Enter Beginning Inventory in Metrc – New York Guide
METRC Integration Overview
How to Find or Generate your METRC API Key
Sync cultivation Data from METRC
METRC -Handle Out Of Sync Package, Item, Plant, Harvest or Strain.
My item is out of sync - How to get it back in sync with METRC
METRC - Killing mature plants - additional details
METRC - Creating clones overview
2. Differences in METRC and non-METRC installations of Flourish Software
METRC MO, OH and MA - include or exclude the prefix in names of items synced from METRC.
METRC - Inbound a package and use it to create clones
Manage METRC Tags
Creating Outbound Shipments and METRC Transfers
METRC Item Brands
METRC - Undo Package - Remove a created package that is out of sync
METRC CA - Edit cultivation tax on Inbound Orders
Metrc - Create a Transfer Template
How to Resync a package
Sync an Item from METRC
Retry sync - a case of invalid tag
METRC "External Transfer" - bring cannabis items into the METRC ecosystem.
Flourish Metrc Processing Job Integration (Manufacturing Runs and Work Orders)
METRC – "Replace Tag" for Plants and Plant Batches
METRC - Get my plants back in sync
Import METRC Categories
Un-map Out of Sync Items
How to order your Metrc Tags
How Retail Returns Sync to METRC
METRC - Update your METRC API Key
Retry Sync after the issue was resolved
METRC - Rename a Harvest
Auto-assign tags to items created by METRC reverse sync
METRC - My Retail Order is Out Of Sync
METRC CA - Reducing Immature Plant Batches - additional details
METRC Harvest - Retry Harvest Sync
METRC - Out of Sync Strain
Find your NYS Metrc License Number and API Key
METRC Permissions
METRC - Mothers Plants and Groups
Retry Sync - Case of "User not Authorized"
The destination Facility cannot receive Packages with the SubmittedForTesting Lab Testing State.
Un-sync An Item From a METRC Facility - Delete a Mapping Record
My package is out of sync
METRC – Change Strain for Plants and Plant Batches
METRC - Get my clone batch back in sync
Release Notes
Previous Release Notes
2020.02.23 - Software Release 4.6.0
2020.03.23 - Software Release 4.8.0
2020.04.06 - Software Release 4.9.0
2020.04.20 Software Release 4.10.0
2020.04.13 - Software Release 4.9.2
2020.05.04 Software Release 4.11
2020.05.18 Software Release 4.12.0
2020.06.01 Software Release 4.13.0
2020.06.15 Software Release 4.14.0
2020.06.22 Software Release 4.14.1
2020.06.29 Software Release 4.15.0
2020.07.13 Software Release 4.16.0
2020.07.27 Software Release 4.17.0
2020.08.10 Software Release 4.18.0
2020.09.02 Software Release 4.19.0
2020.09.14 Software Release 4.20.0
2020.09.28 Software Release 4.21.0
2020.10.12 Software Release 4.22.0
2020.10.26 Software Release 4.23.0
2020.11.09 Software Release 4.24.0
2020.11.30 Software Release 4.25.0
2020.12.14 Software Release 4.26.0
2020.12.29 Software Release 4.26.1
2021.01.11 Software Release 4.28.0
2021.01.25 Software Release 4.29.0
2021.02.09 Software Release 4.30.0
2021.02.25 Software Release 4.31.0
2021.03.09 Software Release 4.32.0
2021.03.23 Software Release 4.33.0
2021.04.09 Software Release 4.34.0
2021.04.21 Software Release 4.35.0
2021.05.03 Software Release 4.36.0
2021.05.18 Software Release 4.37.0
2021.06.08 Software Release 4.38.0
2021.06.29 Software Release 4.39.0
2021.07.20 Software Release 4.40.0
2021.08.03 Software Release 4.41.0
2021.08.17 Software Release 4.42.0
2021.08.31 Software Release 4.43.0
2021.10.05 Software Release 4.45.0
2021.10.19 Software Release 4.46.0
2021.11.02 Software Release 4.47.0
2021.11.16 Software Release 4.48.0
2021.11.30 Software Release 4.49.0
2021.12.14 Software Release 4.50.0
2021.12.28 Software Release 4.51.0
2022.01.11 Software Release 4.52.0
2022.01.25 Software Release 4.53.0
2022.02.08 Software Release 4.54.0
2022.02.22 Software Release 4.55.0
2022.03.08 Software Release 4.56.0
2022.03.22 Software Release 4.57.0
2022.04.05 Software Release 4.58.0
2022.04.19 Software Release 4.59.0
2022.05.03 Software Release 4.60.0
2022.05.17 Software Release 4.61.0
2022.06.01 Software Release 4.62.0
2022.06.14 Software Release 4.63.0
2022.06.28 Software Release 4.64.0
2022.07.12 Software Release 4.65.0
2022.07.26 Software Release 4.66.0
2022.10.18 Software Release 4.72.0
2022.12.13 Software Release 4.76.0
2022.11.15 Software Release 4.74.0
2022.12.28 Software Release 4.77.0
2022.08.23 Software Release 4.68.0
2022.10.04 Software Release 4.71.0
2022.08.09 Software Release 4.67.0
2022.11.1 Software Release 4.73.0
2022.09.07 Software Release 4.69.0
2022.11.29 Software Release 4.75.0
2022.09.20 Software Release 4.70.0
2024.05.30 Software Release 4.106.0
2024.01.23 Software Release 4.100.0
2024.03.26 Software Release 4.103.0
2023.10.17 Software Release 4.96.0
2023.09.06 Software Release 4.94.0
2023.08.08 Software Release 4.92.0
2025.06.24 Software Release 4.119.0
2024.02.13 Software Release 4.101.0
2023.05.02 Software Release 4.85.0
2023.01.24 Software Release 4.79.0
2023.05.16 Software Release 4.86.0
2023.11.28 Software Release 4.98.0
2023.06.13 Software Release 4.88.0
2023.03.21 Software Release 4.83.0
2023.07.25 Software Release 4.91.0
2025.08.04 Software Release 4.120.0
2023.04.04 Software Release 4.84.0
2023.06.27 Software Release 4.89.0
2023.11.06 Software Release 4.97.0
2024.06.26 Software Release 4.107.0
2025.04.01 Software Release 4.114.1
2024.08.20 Software Release 4.109.2
2025.04.23 Software Release 4.116.0
2023.02.21 Software Release 4.81.0
2023.06.01 Software Release 4.87.0
2025.05.13 Software Release 4.117.0
2024.09.10 Software Release 4.111.0
2023.07.11 Software Release 4.90.0
2024.03.05 Software Release 4.102.0
2023.01.10 Software Release 4.78.0
2025.12.07 Release Notes
2023.12.17 Software Release 4.99.0
2025.03.11 Software Release 4.114.0
2024.11.20 Software Release 4.112.0
2023.03.07 Software Release 4.82.0
2024.05.07 Software Release 4.105.0
2025.09.16 Software Release 4.123.0
2025.10.07 Software Release 4.124.0
2023.09.26 Software Release 4.95.0
2025.11.18 Software Release 4.126.0
2025.08.26 Software Release 4.122.0
2023.08.22 Software Release 4.93.0
2023.02.07 Software Release 4.80.0
2025.06.03 Software Release 4.118.0
2024.04.16 Software Release 4.104.0
2025.10.29 Software Release 4.125.0
2026.05 Release Notes
2026.04 Release Notes
2026.03 Release Notes
2026.02 Release Notes
2026.01 Release Notes
QZ Tray
Table of Contents
- All Categories
- Flourish Analytics
- Flourish Analytics - Browse Content
Flourish Analytics - Browse Content
Content Description. Flourish's Analytics Module organizes content into folders focused on a specific topic. These are called Workbooks. A Workbook can have multiple pages and elements. It can be a d…
Content Description
Flourish's Analytics Module organizes content into folders focused on a specific topic. These are called Workbooks. A Workbook can have multiple pages and elements. It can be a dashboard with prompts and controls or a simple report with a data grid.
Flourish supports reporting off live data and a historical dataset that we refresh nightly. The historical data set is very fast; we recommend using this when possible. It replicates what's available in our Flourish API.
Flourish stores the date in Workbooks and Pages.
Workbooks, Pages and Elements
- Workbooks display the tables and visualizations used to view your data. Workbooks contain pages, much like tabs in a spreadsheet.
- Pages contain tables, charts, controls (filters), free-form text, and images to relay information to people who view the workbook.
- Elements are the objects that you put on a workbook page. Element types include:
- Data elements (tables, visualizations, and pivot tables).
- UI elements (text, images, buttons, embeds, spacers, and dividers).
- Control elements (filters and parameters).
Content Structure
There are up to four views of the data, depending on your access level:
Company level
- Live Data
- Historical Data
Facility level
- Live Data
- Historical Data
We've created initial dashboards and reports referencing a data model within each folder. This data model contains all of the data. If you have "Edit and Save" permissions, you can create new content using this and other data models.
Browse The Content
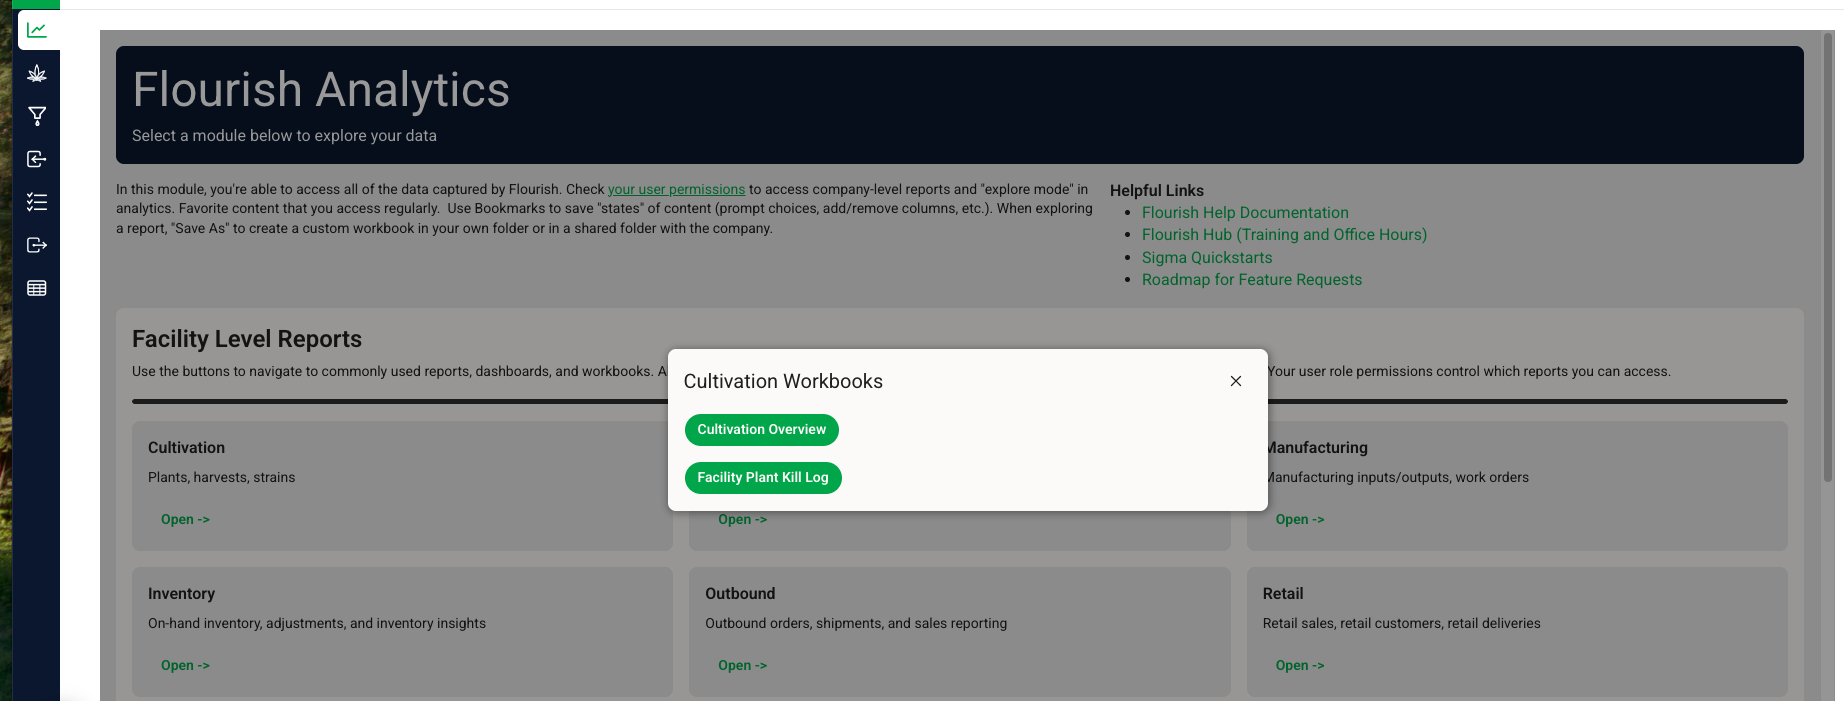
Commonly Used Reports
- Click Analytics
- Locate the module on the Facility Level Reports or the Company Level Reports.
- Click the "Open ->": to show the commonly used reports
All Reports
- Click Analytics.
- Locate the folder icon
 on the bottom left and click it.
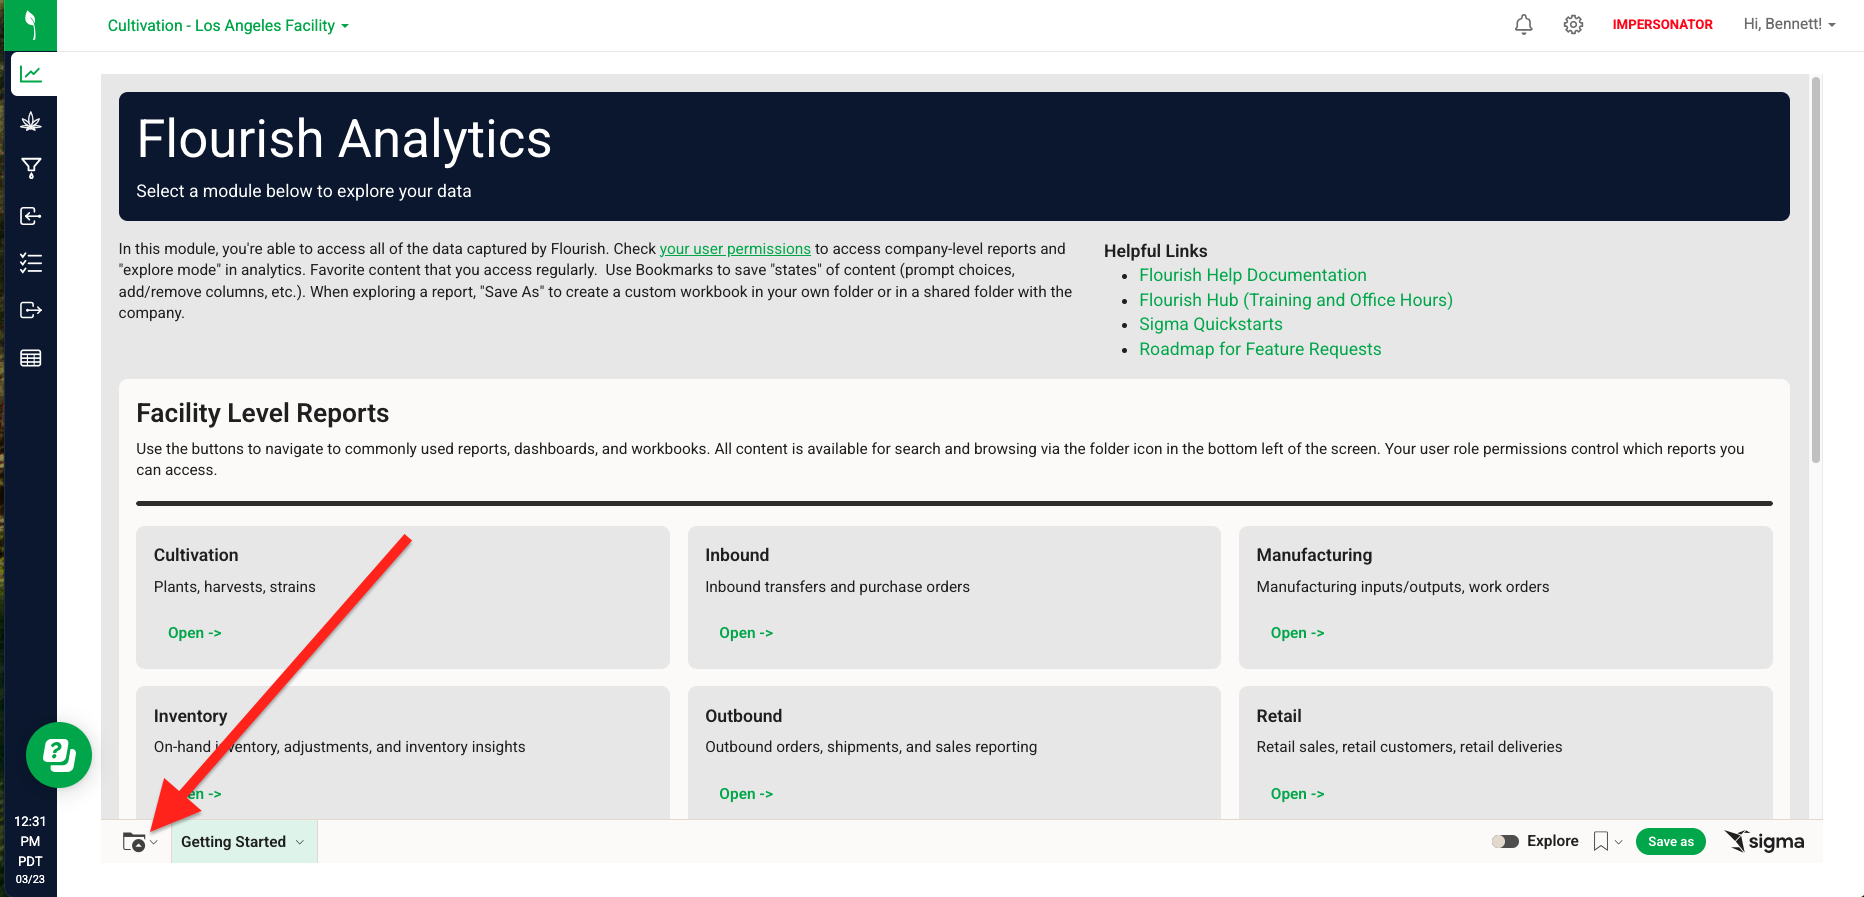
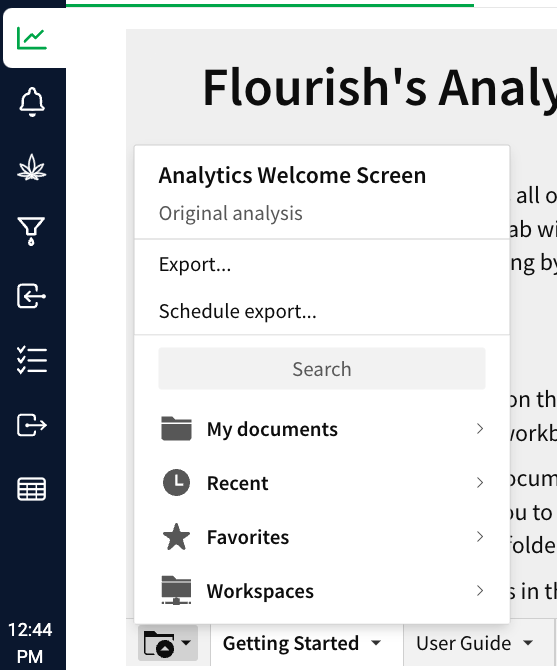
- From here, you can see the following:
- Search line - Type in the search line to find the workbook.
- My Documents - Version of the workbooks you saved.
- Recent - Recent workbooks you visited.
- Favorites - Workbooks you 'Starred' - set as your favorite.
- Workspaces - the folders that contain the data. They are organized as Folder / Sub Folder / Workbook / Page.
How did we do?
Flourish Analytics - Set User Access and Access Level
Flourish Analytics - Set a Workbook as Favorite